
Project 5 · Time Series · Full beginner handbook
Can We Predict Tomorrow's Sales? Build a Retail Forecaster
An online store owner asks a practical question: how many pounds of orders should we plan for tomorrow? Predicting zero means lost opportunities, but predicting too much could waste stock. Use real sales history, not made-up reported accuracy.
What you will build
An offline, reproducible forecasting pipeline built from official UK retail orders: cleaned daily revenue, lag features, chronological validation, a 28-day held-out test and a Streamlit chart comparing model, actual and baseline.
Exact tools you will use
Python 3.12, VS Code, UCI Online Retail, pandas, NumPy, scikit-learn, Ridge, HistGradientBoosting, Streamlit, pytest, GitHub Actions

Real application evidence
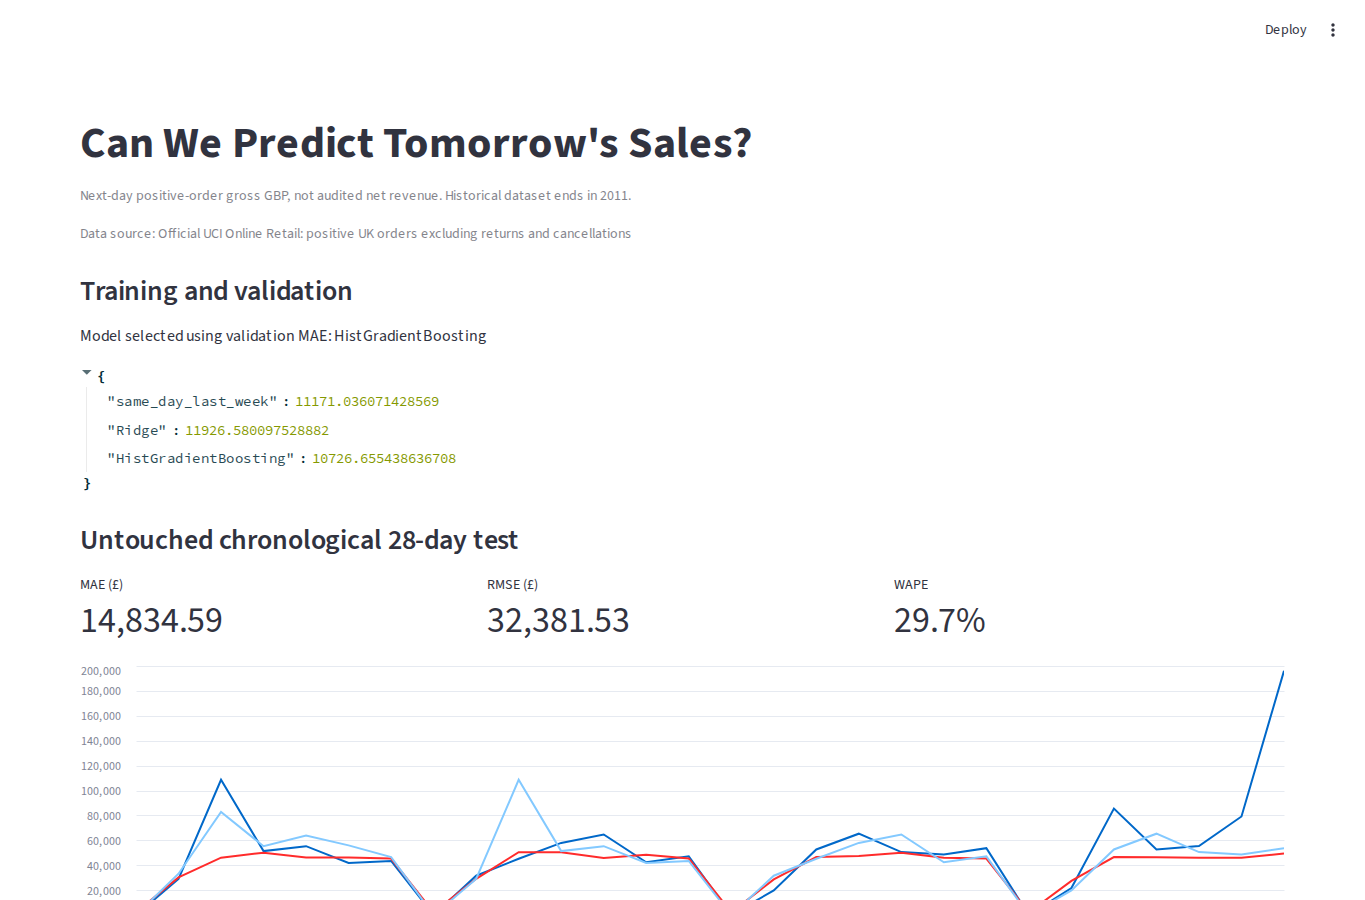
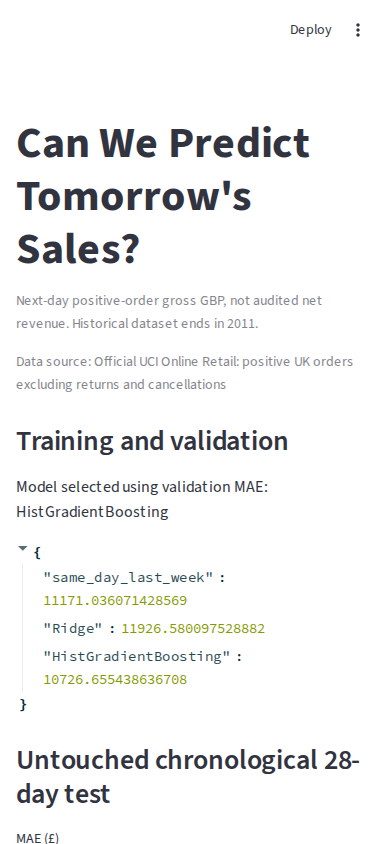
Genuine full-page desktop and mobile screenshots captured from a running Streamlit app by GitHub Actions. Retail evidence uses the actual SHA-256-verified UCI workbook and held-out daily evaluation.
Compute a sales feature and a baseline by hand
- Assume previous seven days sold £100, £120, £90, £130, £110, £140 and £150.
- Prior 7-day mean = (100+120+90+130+110+140+150) / 7 = £120.
- Suppose previous Friday was £100. Seasonal naive for Friday predicts £100, not the seven-day mean.
- If actual Friday sales are £125, absolute error = |125−100| = £25.
- For actual [100,125] and predicted [110,100], MAE = (10+25)/2 = £17.50.
Open the project and understand the sales problem
Why: Time series asks what changes next; its ordering matters.
Do this: Install Python 3.12 and VS Code. Open File → Open Folder → projects/retail-forecasting. Open Terminal → New Terminal.
Check: See download_data.py, train.py, app.py and src/forecast.py.
Create the virtual environment
Why: Python and library versions should be isolated per project.
Do this: Create and activate the environment; install the pinned-compatible packages.
python -m venv .venv
# Windows: .venv\Scripts\activate
# macOS/Linux: source .venv/bin/activate
python -m pip install -r requirements.txt
Check: pip finishes without errors.
Download the authentic UCI retail data
Why: We need observed dated transactions, not an invented demo series.
Do this: Run the verified official UCI archive downloader. It checks the archive SHA-256 before extracting the original workbook.
python download_data.pyCheck: data/Online Retail.xlsx exists and the archive fingerprint matches.
Clean and aggregate daily orders
Why: Cancellations, returns and non-UK orders would change the target definition.
Do this: Read daily_revenue in src/forecast.py. Remove negative/zero quantities and cancelled invoices, retain positive UK orders, multiply quantity by unit price, then aggregate by date.
Check: Daily index includes calendar days. Missing transaction days are zero-filled with an explicit caveat.
Build leakage-free features and chronological splits
Why: A model cannot know tomorrow's actual sales today.
Do this: Read make_features. lag_1 and lag_7 are yesterday and the same weekday last week; both precede the target date. Keep last 28 days for final test and preceding 28 days for validation.
Check: The train maximum date precedes validation; validation precedes test. No random time-series shuffle.
Compare baseline and models; view actual holdout
Why: A complex model must beat a simple business baseline before it is useful.
Do this: Run train.py. Ridge and gradient boosting compete with the same-weekday baseline using validation MAE. The chosen approach is measured once on the untouched holdout.
python -m pytest -q
python train.py
python -m streamlit run app.py
Check: artifacts contains metrics.json, test_predictions.csv, next_day.json and forecast.joblib. Dashboard shows actual, baseline and predictions.
Limitations you should understand
Predicts positive-order gross GBP from the UK subset, not recognized net revenue. One-day-ahead holdout evaluation uses observed earlier days and does NOT demonstrate an entire 28-day future forecast. No promotion or weather features.
Complete source code — copy every file
This is the exact code used in the repository, loaded directly as raw source in the website build. Each file below is complete, not abbreviated. Create the named file inside the project folder, paste it, and then run the commands above.
README.md
# Project 5 — Can We Predict Tomorrow's Sales?

An online shop owner has to decide how much stock to keep for tomorrow. Can sales from the past month help? We build an actual daily sales forecasting pipeline, compare it against the last-week baseline, and show tomorrow's prediction in a Streamlit dashboard.

## Dataset and tools
Official UCI Online Retail dataset, 541,909 transactions from December 2010 to December 2011. Python 3.12, VS Code, pandas, NumPy, scikit-learn, Streamlit and pytest. Data archive verified by SHA-256. No paid service. We predict positive UK order value rather than net recognized revenue.

## Step-by-step
1. Open VS Code, choose File → Open Folder, select projects/retail-forecasting.
2. Open Terminal → New Terminal. Create a virtual environment: python -m venv .venv.
3. Activate it: Windows .venv\Scripts\activate; macOS/Linux source .venv/bin/activate.
4. Run python -m pip install -r requirements.txt.
5. Run python -m pytest -q. These offline synthetic-data smoke tests do not evaluate the real dataset.
6. Run python download_data.py to download and verify official UCI data.
7. Run python train.py. This loads transactions, removes refunds/cancellations, filters UK, groups revenue per day, creates lagged features and compares models.
8. Open artifacts/metrics.json and artifacts/test_predictions.csv to see chosen model, dates and final errors.
9. Run python -m streamlit run app.py and open localhost:8501 in your browser to view charts and next-day forecast.

## Worked numbers
Suppose the past seven days sold £100, £120, £90, £130, £110, £140, £150. The trailing mean is (100+120+90+130+110+140+150)/7 = £120. If last Friday's amount was £100, seasonal naive predicts £100 for next Friday. Actual £125 means an absolute error of £25. We average absolute errors across 28 days to obtain mean absolute error (MAE). The train / validation / test windows follow calendar order: do not randomly split the time series.

## Important limits
A forecast for each of the last 28 test days uses already observed earlier sales as lagged features: it is a sequence of ONE-day-ahead forecasts, not a 28-day recursive future prediction. Closed days and data outages can resemble zero sales. Promotions, supply shortages, weather and holidays are not modeled. No revenue figures are invented: official dataset results appear only after executing train.py.

## Learner checks
Explain why using the current day's revenue as a predictor causes leakage. Calculate MAE for actual [100, 125], predicted [110, 100]: (10+25)/2 = 17.5. Re-run with different lag features and review validation MAE without repeatedly tuning against the test set.
requirements.txt
numpy>=1.26,<3
pandas>=2.2,<3.1
openpyxl>=3.1,<4
scikit-learn>=1.5,<2
joblib>=1.4,<2
streamlit>=1.37,<2
pytest>=8,<10
download_data.py
"""Download official UCI Online Retail, checksum-verified (same source as Project 4)."""
from pathlib import Path
from io import BytesIO
import hashlib
import urllib.request
import zipfile

ROOT = Path(__file__).resolve().parent
URL = "https://archive.ics.uci.edu/static/public/352/online+retail.zip"
SHA = "f5385cbb54bbebf7196389109c6b0621faab0c304e3702548165e71c84aede8b"

def main():
    destination = ROOT / "data" / "Online Retail.xlsx"
    destination.parent.mkdir(parents=True, exist_ok=True)
    if destination.exists():
        print("Existing file:", destination)
        return
    request = urllib.request.Request(URL, headers={"User-Agent": "LearnMLAcademy-Forecasting/1.0"})
    with urllib.request.urlopen(request, timeout=180) as response:
        body = response.read()
    digest = hashlib.sha256(body).hexdigest()
    if digest != SHA:
        raise RuntimeError(f"Official data archive hash changed: {digest}")
    with zipfile.ZipFile(BytesIO(body)) as archive:
        candidates = [n for n in archive.namelist() if n.lower().endswith(".xlsx")]
        if len(candidates) != 1:
            raise RuntimeError("Expected a single spreadsheet in the official archive")
        destination.write_bytes(archive.read(candidates[0]))
    print("Downloaded and checksum-verified:", destination)

if __name__ == "__main__":
    main()
src/forecast.py
"""Leakage-aware one-step-ahead forecasting of positive UK ecommerce order value."""
from pathlib import Path
import json

import joblib
import numpy as np
import pandas as pd
from sklearn.base import clone
from sklearn.ensemble import HistGradientBoostingRegressor
from sklearn.linear_model import Ridge
from sklearn.metrics import mean_absolute_error, mean_squared_error
from sklearn.pipeline import make_pipeline
from sklearn.preprocessing import StandardScaler

ROOT = Path(__file__).resolve().parents[1]
SEED = 42
LAGS = (1, 7, 14, 28)
FEATURES = [f"lag_{n}" for n in LAGS] + ["prior_7_mean", "prior_28_mean", "weekday", "month"]

def daily_revenue(transactions):
    required = {"InvoiceNo", "InvoiceDate", "Quantity", "UnitPrice", "Country"}
    if not required.issubset(transactions.columns):
        raise ValueError("Missing required UCI transaction columns")
    df = transactions.copy()
    df["InvoiceDate"] = pd.to_datetime(df["InvoiceDate"], errors="coerce")
    for col in ("Quantity", "UnitPrice"):
        df[col] = pd.to_numeric(df[col], errors="coerce")
    mask = df["Country"].eq("United Kingdom") & df["InvoiceDate"].notna()
    mask &= df["Quantity"].gt(0) & df["UnitPrice"].gt(0)
    mask &= ~df["InvoiceNo"].astype(str).str.upper().str.startswith("C")
    df = df.loc[mask].copy()
    if df.empty:
        raise ValueError("No valid positive UK sales")
    df["date"] = df["InvoiceDate"].dt.normalize()
    df["positive_sales"] = df["Quantity"] * df["UnitPrice"]
    observed = df.groupby("date")["positive_sales"].sum().sort_index()
    return observed.reindex(pd.date_range(observed.index.min(), observed.index.max(), freq="D"),
                            fill_value=0.0).rename("positive_gross_gbp")

def make_features(series):
    if not isinstance(series.index, pd.DatetimeIndex) or not series.index.is_monotonic_increasing:
        raise ValueError("Daily sales must have sorted DatetimeIndex")
    if len(series) < 130 or series.index.has_duplicates:
        raise ValueError("At least 130 consecutive distinct dates needed")
    if not pd.date_range(series.index.min(), series.index.max(), freq="D").equals(series.index):
        raise ValueError("Calendar has missing days")
    y = pd.to_numeric(series, errors="raise")
    if y.isna().any() or not np.isfinite(y.to_numpy()).all() or (y < 0).any():
        raise ValueError("Sales must be finite and nonnegative")
    x = pd.DataFrame(index=series.index)
    for lag in LAGS:
        x[f"lag_{lag}"] = y.shift(lag)
    x["prior_7_mean"] = y.shift(1).rolling(7).mean()
    x["prior_28_mean"] = y.shift(1).rolling(28).mean()
    x["weekday"] = series.index.dayofweek
    x["month"] = series.index.month
    x["target"] = y
    return x.dropna()

def split_dates(rows):
    if len(rows) < 84:
        raise ValueError("Need enough dates for 28-day validation and 28-day test")
    train, val, test = rows.iloc[:-56], rows.iloc[-56:-28], rows.iloc[-28:]
    assert len(val) == len(test) == 28 and train.index.max() < val.index.min() < test.index.min()
    return train, val, test

def scores(actual, predicted):
    a, p = np.asarray(actual, float), np.asarray(predicted, float)
    if a.shape != p.shape or not np.isfinite(p).all():
        raise ValueError("Nonfinite or wrong-size predictions")
    return {"mae": float(mean_absolute_error(a, p)),
            "rmse": float(np.sqrt(mean_squared_error(a, p))),
            "wape_pct": float(100 * np.abs(a - p).sum() / max(np.abs(a).sum(), 1e-9))}

def candidates():
    return {
        "Ridge": make_pipeline(StandardScaler(), Ridge(alpha=20.0)),
        "HistGradientBoosting": HistGradientBoostingRegressor(
            max_iter=120, learning_rate=0.05, max_leaf_nodes=8,
            l2_regularization=10.0, random_state=SEED),
    }

def train_and_evaluate(daily, destination, source_label="Original fictional daily-sales test fixture"):
    rows = make_features(daily)
    train, val, test = split_dates(rows)
    chosen_mae = {"same_day_last_week": scores(val.target, val.lag_7)["mae"]}
    for name, candidate in candidates().items():
        fitted = clone(candidate).fit(train[FEATURES], train.target)
        chosen_mae[name] = scores(val.target, np.maximum(0, fitted.predict(val[FEATURES])))["mae"]
    winner = min(chosen_mae, key=chosen_mae.get)
    model = None
    if winner != "same_day_last_week":
        model = clone(candidates()[winner]).fit(
            pd.concat([train, val])[FEATURES], pd.concat([train, val]).target)
        prediction = np.maximum(0, model.predict(test[FEATURES]))
    else:
        prediction = test.lag_7.to_numpy()
    report = {
        "dataset": source_label,
        "target": "gross positive GBP order value per day, not accounting net revenue",
        "forecast_contract": "one-step ahead; observed prior daily actuals are available for each day",
        "train_dates": [str(train.index.min().date()), str(train.index.max().date())],
        "val_dates": [str(val.index.min().date()), str(val.index.max().date())],
        "test_dates": [str(test.index.min().date()), str(test.index.max().date())],
        "n_daily": len(daily),
        "validation_mae": chosen_mae,
        "selected_model": winner,
        "test_selected": scores(test.target, prediction),
        "test_baseline": scores(test.target, test.lag_7),
    }
    destination = Path(destination)
    destination.mkdir(parents=True, exist_ok=True)
    joblib.dump({"model": model, "winner": winner}, destination / "forecast.joblib")
    pd.DataFrame({"actual": test.target, "predicted": prediction,
                  "last_week": test.lag_7}, index=test.index).to_csv(
                      destination / "test_predictions.csv", index_label="date")
    next_date = daily.index[-1] + pd.Timedelta(days=1)
    next_row = {**{f"lag_{i}": float(daily.iloc[-i]) for i in LAGS},
                "prior_7_mean": float(daily.iloc[-7:].mean()),
                "prior_28_mean": float(daily.iloc[-28:].mean()),
                "weekday": int(next_date.dayofweek), "month": int(next_date.month)}
    x = pd.DataFrame([next_row])[FEATURES]
    future = float(x.lag_7.iloc[0] if model is None else max(0, model.predict(x)[0]))
    (destination / "next_day.json").write_text(json.dumps(
        {"date": str(next_date.date()), "forecast_gbp": round(future, 2)}, indent=2) + "\n")
    (destination / "metrics.json").write_text(json.dumps(report, indent=2) + "\n")
    return report
train.py
"""Train on real official data: python download_data.py && python train.py."""
import pandas as pd
from src.forecast import ROOT, daily_revenue, train_and_evaluate

source = ROOT / "data" / "Online Retail.xlsx"
if not source.is_file():
    raise SystemExit("Run python download_data.py first.")
df = pd.read_excel(source, engine="openpyxl")
if len(df) != 541_909:
    raise SystemExit(f"Official dataset expected 541909 rows, found {len(df)}")
result = train_and_evaluate(daily_revenue(df), ROOT / "artifacts",
    source_label="Official UCI Online Retail: positive UK orders excluding returns and cancellations")
print("Selected model:", result["selected_model"])
print("Final untouched holdout:", result["test_selected"])
app.py
"""Read-only student dashboard; train first to generate real data and artifacts."""
from pathlib import Path
import json
import pandas as pd
import streamlit as st

ROOT = Path(__file__).resolve().parent
st.set_page_config(page_title="Retail Sales Forecast", layout="wide")
st.title("Can We Predict Tomorrow's Sales?")
st.caption("Next-day positive-order gross GBP, not audited net revenue. Historical dataset ends in 2011.")
metric_file = ROOT / "artifacts" / "metrics.json"
if not metric_file.is_file():
    st.warning("First run python download_data.py then python train.py")
    st.stop()
report = json.loads(metric_file.read_text())
st.caption("Data source: " + report["dataset"])
st.subheader("Training and validation")
st.write("Model selected using validation MAE:", report["selected_model"])
st.json(report["validation_mae"])
st.subheader("Untouched chronological 28-day test")
a, b, c = st.columns(3)
a.metric("MAE (£)", f"{report['test_selected']['mae']:,.2f}")
b.metric("RMSE (£)", f"{report['test_selected']['rmse']:,.2f}")
c.metric("WAPE", f"{report['test_selected']['wape_pct']:.1f}%")
data = pd.read_csv(ROOT / "artifacts" / "test_predictions.csv", parse_dates=["date"])
st.line_chart(data.set_index("date")[["actual", "predicted", "last_week"]])
st.dataframe(data, use_container_width=True)
tomorrow = json.loads((ROOT / "artifacts" / "next_day.json").read_text())
st.metric("Next observed date: " + tomorrow["date"], f"£{tomorrow['forecast_gbp']:,.2f}")
st.info("This is one-day-ahead forecasting with observed lags, not a forecast of the entire next month. Zero-filled dates may represent shop closure.")
tests/test_forecast.py
import numpy as np
import pandas as pd
import pytest
from src.forecast import daily_revenue, make_features, split_dates, train_and_evaluate, scores

def sales():
    dates = pd.date_range("2025-01-01", periods=175, freq="D")
    return pd.Series(100 + .35 * np.arange(175) + 10 * np.sin(np.arange(175) * 2*np.pi/7),
                     index=dates)

def test_transaction_cleaning():
    frame = pd.DataFrame({"InvoiceNo": ["100", "C101", "102"],
                          "InvoiceDate": ["2025-01-01"] * 3,
                          "Quantity": [2, -1, 4], "UnitPrice": [5, 5, 5],
                          "Country": ["United Kingdom", "United Kingdom", "France"]})
    assert daily_revenue(frame).iloc[0] == 10

def test_features_only_use_the_past():
    y = sales()
    x = make_features(y)
    assert x.iloc[0].lag_1 == y.iloc[27]
    assert x.iloc[0].lag_7 == y.iloc[21]
    t = y.index[50]
    modified = y.copy()
    modified.loc[t] = 999999
    assert make_features(modified).loc[t, "lag_1"] == x.loc[t, "lag_1"]
    with pytest.raises(ValueError):
        make_features(y.drop(y.index[17]))

def test_split_chronologically():
    train, val, test = split_dates(make_features(sales()))
    assert train.index.max() < val.index.min() < test.index.min()
    assert len(val) == 28 and len(test) == 28

def test_training_and_real_file_outputs(tmp_path):
    report = train_and_evaluate(sales(), tmp_path)
    assert report["selected_model"] in ("Ridge", "HistGradientBoosting", "same_day_last_week")
    assert len(pd.read_csv(tmp_path / "test_predictions.csv")) == 28
    assert (tmp_path / "forecast.joblib").exists()
    assert (tmp_path / "next_day.json").exists()

def test_zero_actuals_wape():
    assert scores([0, 0], [0, 0])["wape_pct"] == 0
Project verification workflow
name: Three Remaining Projects — Engineering Verify
on:
  push:
    branches:
      - feat/complete-three-projects-20261009
  pull_request:
    paths:
      - 'projects/digit-recognizer/**'
      - 'projects/retail-forecasting/**'
      - 'projects/disaster-tweets/**'
      - 'src/pages/*ProjectPage.tsx'
      - 'src/data/projectPortfolio.ts'
      - '.github/workflows/three-projects-verify.yml'
  workflow_dispatch:

jobs:
  retail:
    runs-on: ubuntu-latest
    timeout-minutes: 15
    defaults:
      run:
        working-directory: projects/retail-forecasting
    steps:
      - uses: actions/checkout@v4
      - uses: actions/setup-python@v5
        with:
          python-version: '3.12'
          cache: pip
          cache-dependency-path: projects/retail-forecasting/requirements.txt
      - run: python -m pip install -r requirements.txt
      - run: python -m pytest -q
      - run: python -m compileall -q src train.py download_data.py app.py
  disaster:
    runs-on: ubuntu-latest
    timeout-minutes: 15
    defaults:
      run:
        working-directory: projects/disaster-tweets
    steps:
      - uses: actions/checkout@v4
      - uses: actions/setup-python@v5
        with:
          python-version: '3.12'
          cache: pip
          cache-dependency-path: projects/disaster-tweets/requirements.txt
      - run: python -m pip install -r requirements.txt
      - run: python -m pytest -q
      - run: python -m compileall -q src train.py app.py
  digits:
    runs-on: ubuntu-latest
    timeout-minutes: 25
    defaults:
      run:
        working-directory: projects/digit-recognizer
    steps:
      - uses: actions/checkout@v4
      - uses: actions/setup-python@v5
        with:
          python-version: '3.12'
      - run: python -m pip install -r requirements.txt
      - run: python -m pytest -q
      - run: python -m compileall -q src train.py app.py
  website:
    runs-on: ubuntu-latest
    timeout-minutes: 15
    steps:
      - uses: actions/checkout@v4
      - uses: actions/setup-node@v4
        with:
          node-version: '22'
          cache: npm
      - run: npm ci
      - run: npm run lint
      - run: npm run build
Your build checkpoints — Retail Sales Forecaster
Keep the full handbook and all source code visible above. These optional checkpoints help you track what you can actually build and explain. Progress is saved only in this browser.
0 of 5 checkpoints completed
Predict → change → observe → explain
Before: Predict whether last week's sales would beat a simple rolling-average forecast.
Try: Compare the actual chronological validation errors of two lag-based forecasts.
Show your evidence: Compute a mean absolute error from the held-out daily differences.
Environment setup on your computer
Unzip the source first, open its project folder in VS Code, then read its README for dataset/download instructions. Python 3.12 is the documented starting version for this project; follow its README if it specifies a more exact patch release.
Windows PowerShell commands
py -3.12 -m venv .venv
.\.venv\Scripts\python.exe -m pip install -r requirements.txt
.\.venv\Scripts\python.exe -m pip check
macOS / Linux commands
python3.12 -m venv .venv
.venv/bin/python -m pip install -r requirements.txt
.venv/bin/python -m pip check
No global package installation or machine-wide policy changes are necessary. For Windows, explicit environment Python avoids PowerShell activation-policy issues. PyTorch or downloaded datasets may require substantial disk space.
Optional: publish a small demo safely
- Finish the local test, save a screenshot and check your actual saved model or index works after restart.
- Use a repository you control. Exclude API keys, .env files, personal uploads, unlicensed datasets and generated sensitive artifacts.
- Choose a host that supports your actual Python and system dependencies. If a model or data file is generated locally, plan a permitted and reproducible build step before expecting a cloud demo to start.
- Test the real hosted application on desktop and mobile, including invalid inputs, empty answers, missing model files and service restarts.
- Do not expose a paid AI key or an unrestricted inference endpoint to the public; add user authentication, rate limits and spending limits first. Keep a local-only demonstration if you cannot protect it.
This is an optional safety checklist, not a claim that any project already has a public deployed demo.
Important limitation: One-day-ahead forecasts using observed prior days are not 28-day recursive future forecasts.